Where’s The Value In New Measurement Tools For Retail?
Retail has become so much more complicated in recent years on both the customer order side (buy-online-pickup-instore) and on the supply side (bottlenecks, supply chain interruptions) – that the old ways of measuring success (same store sales, labor ratio-to-revenue) just won’t cut it.
In fact, these “old school metrics” are really scorecards, not real time alerts or calls to action.
What retailers desperately need now, in order to act and react to real-time events as they continue to unfold at a breakneck pace, is a whole new generation of Key Performance Indicators (KPIs). In our most recent research report, How Retailers Are Operationalizing Analytics With New KPIs, we found lots of data about how retailers are planning for – and investing in – these new tools.
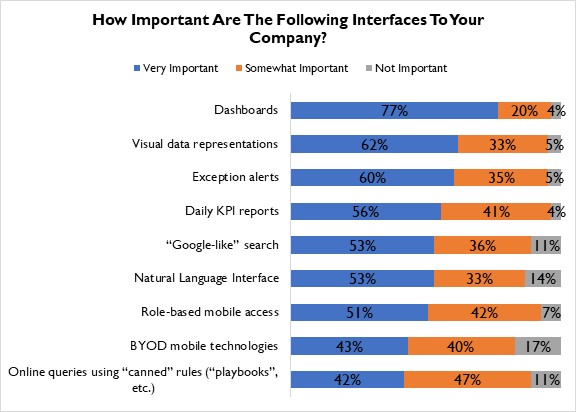
And when it comes to perceived value of the technologies at hand, retailers couldn’t be any clearer: they want dashboard-style tools (Figure 1).
Figure 1: Dashboards Rule The Roost

Source: RSR Research, June 2022
In fact, when the preferences from Figure 1 are analyzed, a clear picture comes into focus; while next-gen analytics ramp up in the complexity of what they can do, that does not mean the user interface should. Retailers say “bring on the capability – but keep it clean from a visual point of view.” They want consumer-grade visuals (visual data representations, exception alerts, even Google-like search functions) across the board, as the progression towards data-enabled-decision-making-for-all marches on.
This is something technologists have (historically… sometimes) struggled to keep in mind. Understandably impressed by the technical prowess of their wares, KPI tools can often reflect the pride of their technical developers. However, Figure 1 serves as a reminder to keep it simple – no matter how vast the capabilities may become.
A Practical Matter
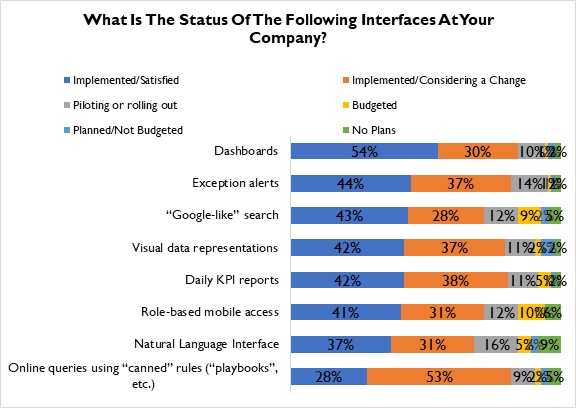
While perceived value is important, Figure 2 picks up where Figure 1 left off: retailers are already enamored of tools that can make truly complicated tasks within the enterprise easier to identify understand, and act upon. Dashboards are not only how they want to consume this information – it’s how they are already electing to do so.
Figure 2: The Dashboard Light

Source: RSR Research, June 2022
We hope you take the time to read the full report. It goes into detail not just about which technologies retailers value and use, but perhaps more importantly: which they are planning to buy next.
