Our Annual Website Evaluation: How/Why We Do It, And Who’s On The Podium?
In what has become an annual tradition, each spring, Retail Systems Research sets out to evaluate retailers’ online digital offerings, serving up a report in summer: a mid-year state-of-the-union for how the industry is doing.
We begin with a list of roughly 80 retailers, all with a strong eCommerce presence. This year we focused on brands whose rank fell between numbers 25 and 130 on the Internet Retailer Top 500 list. As in years past, we eliminated all retailers offering subscription services, as well as those selling auto parts. Each retailer falls squarely into a standardized retail category (such as Apparel/ Accessories, Sporting Goods, Health & Beauty, etc.).
As usual, we evaluated these brands’ website performance across multiple criteria (the complete list is at the back of the full report). Most of the criteria reoccur for the purpose of year-over-year analysis, (speed of site-load, time to product detail page), but because this research is forever evolving, this year we focused primarily on retailers’ mobile sites, due to consumers’ rapidly increasing trend to make that channel their primary point of contact with a brand and its products. The only area where we evaluated their desktop offering was in how closely its shopping experience resembled that of the mobile site (overall content, number of promotions, etc.).
We then went ahead and surveyed 1,100 US-based consumers ages 18 and up, gathering their perspective on how online retailers are doing in terms of site performance. This data appears throughout the report, providing first-hand context for what shoppers deem most important, as well as their behaviors for when things go awry.
And while this research has morphed and grown since we started it four years ago, 2020 has proven to be a particularly important – and unique – time to evaluate the way retailers sell online. The reason? The COVID-19 outbreak has rendered a precise online shopping experience something to be more than a nice-to-have; it is now an imperative.
Historically, the results of this annual report have been less than stellar, and that remains the case this year. For example, while average mobile page load time improved this year from 9.25 to 7 seconds, it is still far from the 3 second mark that shoppers expect. And while we penalized specific retailers for things like slow load times and aggressive use of chatbots, if you read the report, you’ll find our chiding is more about leaving money on the table.
And as we do every year, there are new data points. Last year we introduced consumer sentiment into the model, a feature we continue in the 2020 edition. This year we introduced measurement of services on checkout to understand shopper data risk.
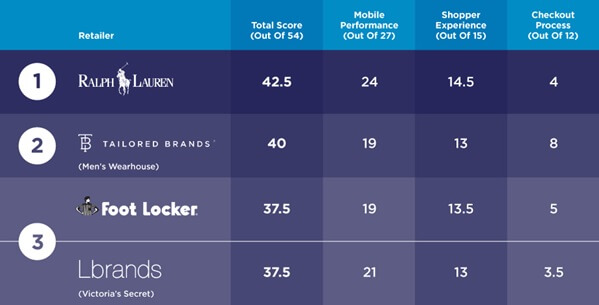
Hence, this year’s report card score is more important than ever. So who scored what? Well, this is just a newsletter article, so we can’t get give the full results here. But check out the podium:

Read the full report to find out your brand might have fared – it’s free, and available to all registered users (registration is also free).
